Using the results obtained from the corrp function, this function creates a correlation matrix.
Arguments
- c
[
clist]
Output from thecorrpfunction.- ...
Not used. Included for S3 method consistency.
- col
[
character(1)]
Specifies the column to be used in the correlation matrix.- isig
[
logical(1)]
Determines whether values that are not statistically significant should be represented by NA or FALSE in the correlation matrix.
Value
[cmatrix]
A square matrix with class "cmatrix" where each cell [i,j] contains the correlation value between variables i and j.
The correlation values are taken from the specified column (infer.value, stat.value, or isig) of the input clist.
When isig=TRUE, only statistically significant correlations are included, others are set to NA.
Examples
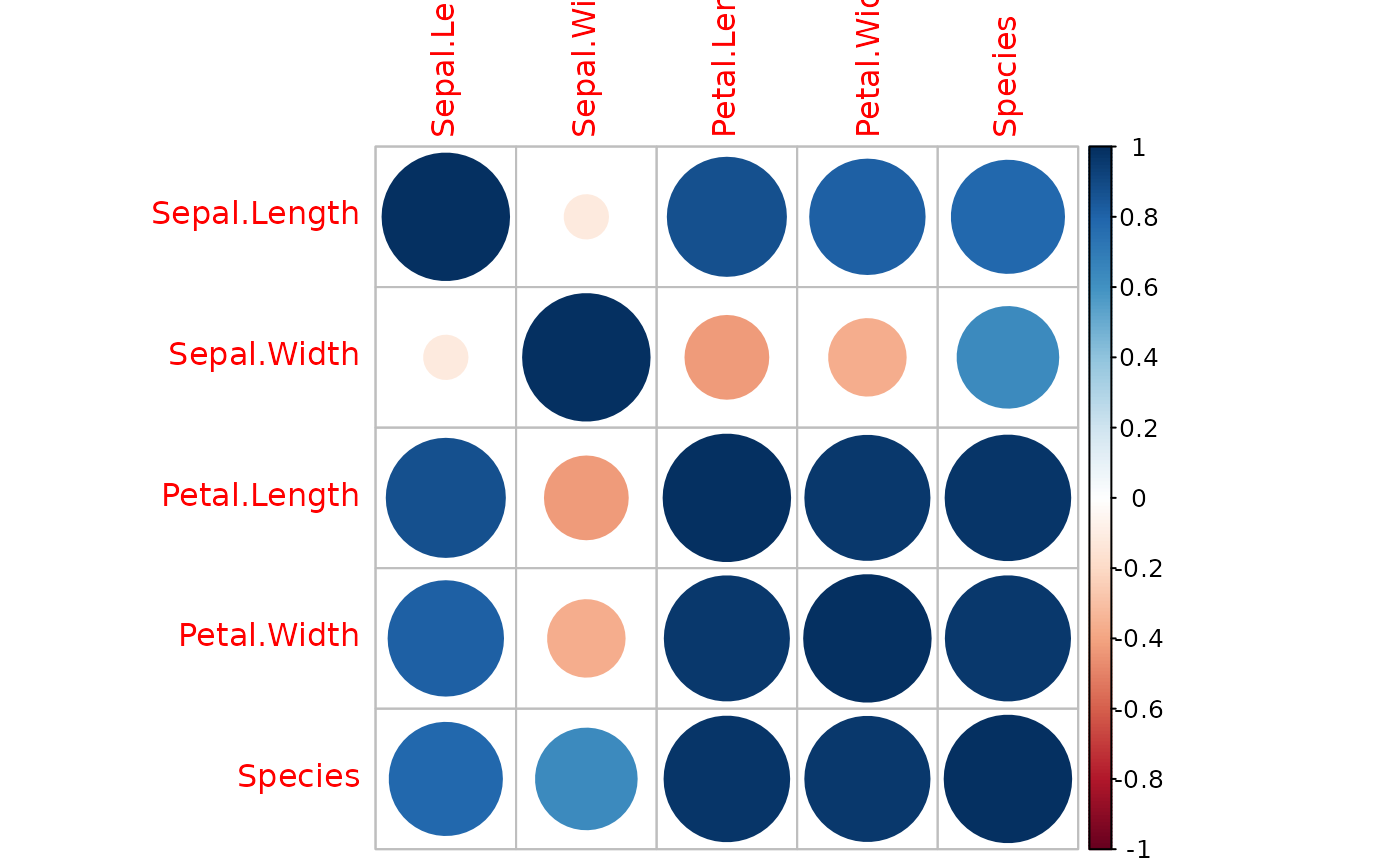
iris_cor <- corrp(iris)
iris_m <- corr_matrix(iris_cor, isig = FALSE)
if (require("corrplot")) {
  corrplot(iris_m) # You can visualize the matrix using corrplot
}
#> Loading required package: corrplot
#> corrplot 0.95 loaded